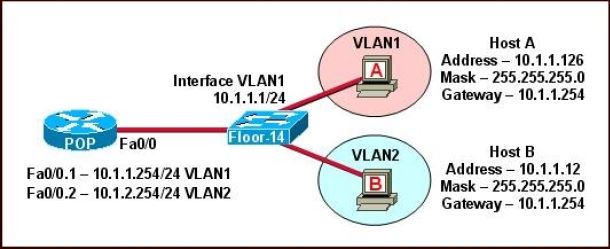
The network shown in the diagram is experiencing connectivity problems. Which of the following will correct the problems? (Choose two.)
A. Configure the gateway on Host A as 10.1.1.1. B. Configure the gateway on Host B as 10.1.2.254. C. Configure the IP address of Host A as 10.1.2.2. D. Configure the IP address of Host B as 10.1.2.2. E. Configure the masks on both hosts to be 255.255.255.224. F. Configure the masks on both hosts to be 255.255.255.240.
Correct Answers: B, D
Explanation:
The switch 1 is configured with two VLANs: VLAN1 and VLAN2.
The IP information of member Host A in VLAN1 is as follows:
Address : 10.1.1.126
Mask : 255.255.255.0
Gateway : 10.1.1.254
The IP information of member Host B in VLAN2 is as follows:
Address : 10.1.1.12
Mask : 255.255.255.0
Gateway : 10.1.1.254
The configuration of sub-interface on router 2 is as follows:
Fa0/0.1 — 10.1.1.254/24 VLAN1
Fa0/0.2 — 10.1.2.254/24 VLAN2
It is obvious that the configurations of the gateways of members in VLAN2 and the associated network segments are wrong. The layer3 addressing information of Host B should
be modified as follows:
Address : 10.1.2.X
Mask : 255.255.255.0
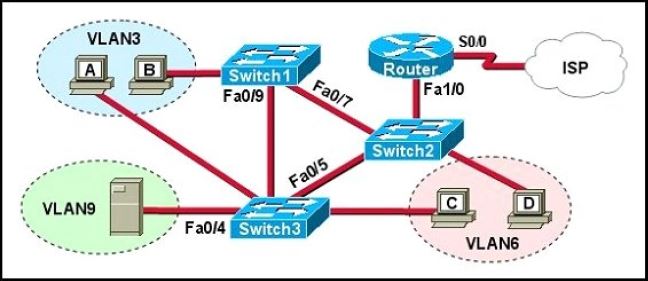
A problem with network connectivity has been observed. It is suspected that the cable connected to switch port Fa0/9 on Switch1 is disconnected. What would be an effect of this cable being disconnected?
A. Host B would not be able to access the server in VLAN9 until the cable is reconnected. B. Communication between VLAN3 and the other VLANs would be disabled. C. The transfer of files from Host B to the server in VLAN9 would be significantly slower. D. For less than a minute, Host B would not be able to access the server in VLAN9. Then normal network function would resume.
Correct Answer: D
Explanation:
Spanning-Tree Protocol (STP) is a Layer 2 protocol that utilizes a special-purpose algorithm to discover physical loops in a network and effect a logical loop-free topology. STP creates a loop-free tree structure consisting of leaves and branches that span the entire Layer 2 network. The actual mechanics of how bridges communicate and how the STP algorithm works will be discussed at length in the following topics. Note that the terms bridge and switch are used interchangeably when discussing STP. In addition, unless otherwise indicated, connections between switches are assumed to be trunks.
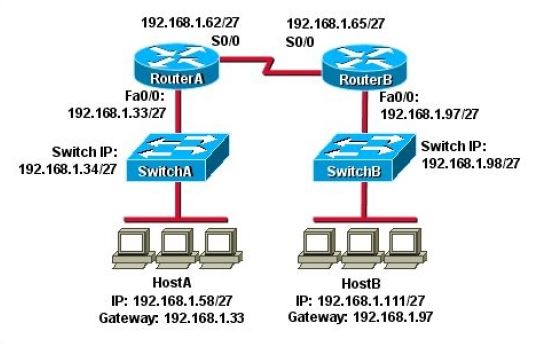
HostA cannot ping HostB. Assuming routing is properly configured, what is the cause of this problem?
A. HostA is not on the same subnet as its default gateway. B. The address of SwitchA is a subnet address. C. The Fa0/0 interface on RouterA is on a subnet that can’t be used. D. The serial interfaces of the routers are not on the same subnet. E. The Fa0/0 interface on RouterB is using a broadcast address.
Correct Answer: D
Explanation:
Now let’s find out the range of the networks on serial link:
For the network 192.168.1.62/27:
Increment: 32
Network address: 192.168.1.32
Broadcast address: 192.168.1.63
For the network 192.168.1.65/27:
Increment: 32
Network address: 192.168.1.64
Broadcast address: 192.168.1.95
-> These two IP addresses don’t belong to the same network and they can’t see each other.
Which router IOS commands can be used to troubleshoot LAN connectivity problems? (Choose three.)
A. ping B. tracert C. ipconfig D. show ip route E. winipcfg F. show interfaces
Correct Answers: A, D, F
Explanation:
Ping, show ip route, and show interfaces are all valid troubleshooting IOS commands. Tracert, ipconfig, and winipcfg are PC commands, not IOS.
A network administrator is troubleshooting the OSPF configuration of routers R1 and R2. The routers cannot establish an adjacency relationship on their common Ethernet link.
The graphic shows the output of the show ip ospf interface e0 command for routers R1 and R2. Based on the information in the graphic, what is the cause of this problem?
A. The OSPF area is not configured properly. B. The priority on R1 should be set higher. C. The cost on R1 should be set higher. D. The hello and dead timers are not configured properly. E. A backup designated router needs to be added to the network. F. The OSPF process ID numbers must match.
Correct Answer: D
Explanation:
In OSPF, the hello and dead intervals must match and here we can see the hello interval is set to 5 on R1 and 10 on R2. The dead interval is also set to 20 on R1 but it is 40 on R2.
In which circumstance are multiple copies of the same unicast frame likely to be transmitted in a switched LAN?
A. during high traffic periods B. after broken links are re-established C. when upper-layer protocols require high reliability D. in an improperly implemented redundant topology E. when a dual ring topology is in use
Correct Answer: D
Explanation:
If we connect two switches via 2 or more links and do not enable STP on these switches then a loop (which creates multiple copies of the same unicast frame) will occur. It is an example of an improperly implemented redundant topology.
What are three reasons to collect Netflow data on a company network? (Choose three.)
A. To identify applications causing congestion. B. To authorize user network access. C. To report and alert link up / down instances. D. To diagnose slow network performance, bandwidth hogs, and bandwidth utilization. E. To detect suboptimal routing in the network. F. To confirm the appropriate amount of bandwidth that has been allocated to each Class of Service.
Correct Answers: A, D, F
Explanation:
NetFlow facilitates solutions to many common problems encountered by IT professionals.
+ Analyze new applications and their network impact
Identify new application network loads such as VoIP or remote site additions. + Reduction in peak WAN traffic
Use NetFlow statistics to measure WAN traffic improvement from application-policy changes; understand who is utilizing the network and the network top talkers. + Troubleshooting and understanding network pain points
Diagnose slow network performance, bandwidth hogs and bandwidth utilization quickly with command line interface or reporting tools. -> D is correct. + Detection of unauthorized WAN traffic
Avoid costly upgrades by identifying the applications causing congestion. -> A is correct. + Security and anomaly detection
NetFlow can be used for anomaly detection and worm diagnosis along with applications such as Cisco CS-Mars. + Validation of QoS parameters
Confirm that appropriate bandwidth has been allocated to each Class of Service (CoS) and that no CoS is over- or under-subscribed.-> F is correct.
What Netflow component can be applied to an interface to track IPv4 traffic?
A. flow monitor B. flow record C. flow sampler D. flow exporter
Correct Answer: A
Explanation:
Flow monitors are the Flexible NetFlow component that is applied to interfaces to perform network traffic monitoring. Flow monitors consist of a record and a cache. You add the record to the flow monitor after you create the flow monitor. The flow monitor cache is automatically created at the time the flow monitor is applied to the first interface. Flow data is collected from the network traffic during the monitoring process based on the key and non-key fields in the record, which is configured for the flow monitor and stored in the flow monitor cache.
For example, the following example creates a flow monitor named FLOW-MONITOR-1 and enters Flexible NetFlow flow monitor configuration mode:
What Cisco IOS feature can be enabled to pinpoint an application that is causing slow network performance?
A. SNMP B. Netflow C. WCCP D. IP SLA
Correct Answer: B
Explanation:
Netflow can be used to diagnose slow network performance, bandwidth hogs and bandwidth utilization quickly with command line interface or reporting tools.
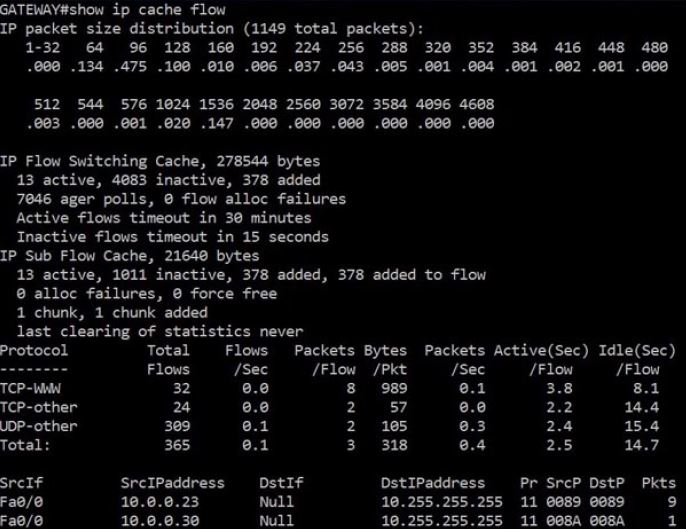
What command visualizes the general NetFlow data on the command line?
A. show ip flow export B. show ip flow top-talkers C. show ip cache flow D. show mls sampling E. show mls netflow ip
Correct Answer: C
Explanation:
The following is an example of how to visualize the NetFlow data using the CLI. There are three methods to visualize the data depending on the version of Cisco IOS Software.
The traditional show command for NetFlow is “show ip cache flow” also available are two forms of top talker commands. One of the top talkers commands uses a static configuration to view top talkers in the network and another command called dynamic top talkers allows real-time sorting and aggregation of NetFlow data. Also shown is a show MLS command to view the hardware cache on the Cisco Catalyst 6500 Series Switch.
The following is the original NetFlow show command used for many years in Cisco IOS Software. Information provided includes packet size distribution; basic statistics about number of flows and export timer setting, a view of the protocol distribution statistics and the NetFlow cache.
The “show ip cache flow” command displays a summary of the NetFlow accounting statistics.