What are three factors a network administrator must consider before implementing Netflow in the network? (Choose three.)
A. CPU utilization B. where Netflow data will be sent C. number of devices exporting Netflow data D. port availability E. SNMP version F. WAN encapsulation
Correct Answers: A, B, C
Explanation:
NetFlow has a reputation for increasing CPU utilization on your network devices. Cisco’s performance testing seems to indicate that newer hardware can accommodate this load pretty well, but you will still want to check it out before you turn on the feature. Some symptoms of high CPU utilization are very large jitter and increased delay. Services running
on the device may also be affected.
Another thing to keep in mind is the amount of data you’re going to be sending across the network. Depending on how much traffic you have and how you configure it, the traffic can be substantial. For example, you may not want to send NetFlow data from a datacenter switch to a NetFlow collector on the other side of a small WAN circuit. Also bear in mind that the flows from aggregating large numbers of devices can add up.
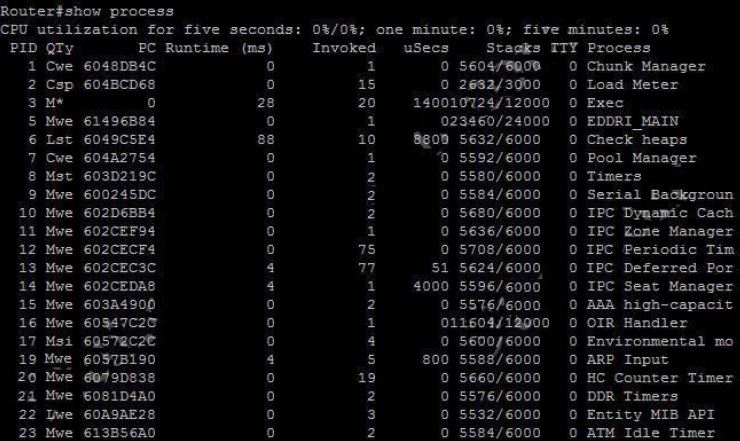
A. show protocols B. show process C. show system D. show version
Correct Answer: B
Explanation:
The “show process” (in fact, the full command is “show processes”) command gives us lots of information about each process but in fact it is not easy to read. Below shows the output of this command (some next pages are omitted).
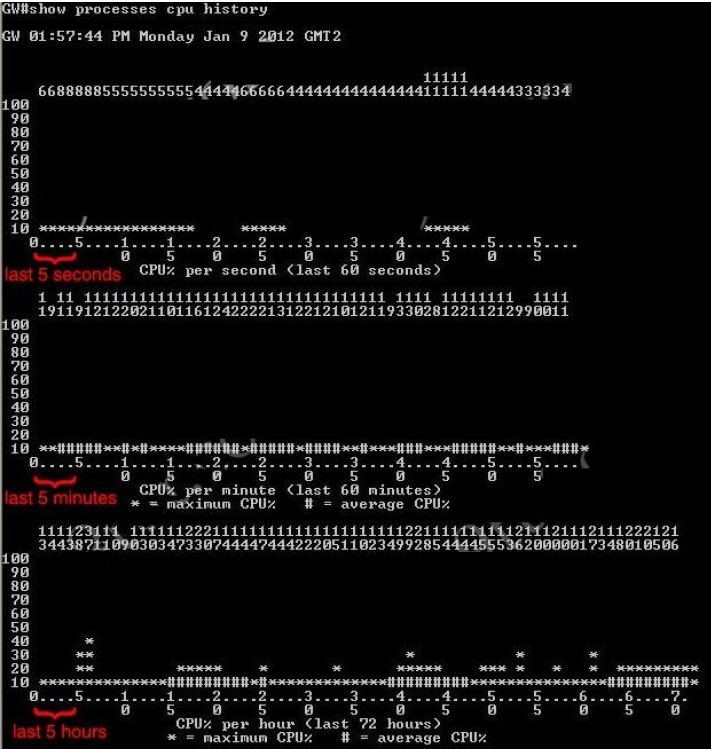
A more friendly way to check the CPU utilization is the command “show processes cpu history”, in which the total CPU usage on the router over a period of time: one minute, one hour, and 72 hours are clearly shown:
+ The Y-axis of the graph is the CPU utilization.
+ The X-axis of the graph is the increment within the period displayed in the graph.
For example, from the last graph (last 72 hours) we learn that the highest CPU utilization within 72 hours is 37% about six hours ago.